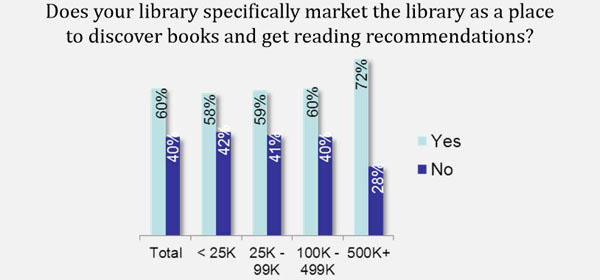
Amid the chatter of new technologies and service models, sometimes more “traditional” library services can be lost in the noise. Library Journal surveyed nearly 700 public libraries in the U.S. and Canada to get a better picture of one of those traditional services: readers’ advisory (RA).
While every single library offered personal RA in the library, the actual service model varied. A strong majority (85%) offered RA at the reference desk, and 59% offered the service at the circulation desk. Nearly all respondents also offered self-directed RA, ranging from book displays (94%) to printed resources (75%) to shelf talkers (39%). Digital RA is also popular—more than 9 in 10 libraries (93%) offered it—with most service taking the form of online resources like book lists and read-alikes. Social media is also a popular outlet, with about half of libraries (49%) using social tools specifically for book recommendations.
Nearly 3 in 5 public libraries (59%) measured RA services in some way, typically through usage statistics from e-resources like NoveList (38%) or tracking the number of RA-related questions (24%). Unfortunately, measuring general RA service success is much more limited, with just 9% of libraries monitoring return RA business and only 4% offer a feedback loop on the quality of staff recommendations.
Interestingly, at 7 out of 10 public libraries, RA services were provided by the entire staff. About a quarter of libraries (26%) had certain staff or subject specialists who offered RA, and less than 1 in 10 (9%) had full-time readers’ advisors on staff. Generally, staff felt challenged when faced with keeping up with new books, authors, and genres, but most (61%) rely on book recommendation databases like NoveList and professional journals (42%) to keep up with trends.
Check out our other recent Weekly Number posts where we discuss reports on adults’ reading habits and children’s consumption of educational media.
Note: This post is part of our series, “The Weekly Number.” In this series, we highlight statistics that help tell the story of the 21st-century library.