In 2008, the Library Research Service launched the biennial study, U.S. Public Libraries and the Use of Web Technologies, with the intent to document the use of various web technologies on the websites of public libraries throughout the nation. From its inception, it was conceived as a longitudinal study, with plans to revisit the sample libraries every two years to track changes in libraries’ uses of web technologies. The study is conducted as a content analysis: researchers analyze a random sample, stratified based on legal service area (LSA) population, of public library websites throughout the United States (584 in 2012), as well as the websites of all public libraries in Colorado (114—9 of which are in the national sample). The results of the 2008 study set a baseline for the adoption of web technologies nationwide. The study was repeated in 2010 and 2012, and these iterations expanded upon the 2008 findings by tracking the trends in U.S. public libraries’ use of web technologies over time as well as by examining new technologies as they emerged. Highlights from the 2012 study are presented below:
In 2012, most U.S. public libraries in the sample had websites, including:
- all of those serving LSA populations of 25,000 and more;
- 98 percent of those with LSA populations of 10,000 to 24,999; and,
- a little more than 4 in 5 (83%) of those serving LSA populations less than 10,000 (up from 71% in 2010).
Over time, library websites were analyzed for the presence of several web features that enable interactivity with users (for example, virtual reference, blogs, etc.). Some notable findings included:
- Generally, the biggest increases in terms of adoption of these features occurred in the smallest libraries. This was true for online account access (45% in 2010 vs. 70% in 2012), blogs (6% vs. 10%), RSS feeds (10% vs. 20%), and catalog search boxes (14% vs. 25%).
- In contrast, in larger libraries, many of these features either remained relatively constant or declined from 2010 to 2012. One notable exception was text reference, which increased from 13 percent to 43 percent in libraries serving more than 500,000.
- In most libraries, regardless of size, ShareThis/AddThis features increased, email newsletters and online library card sign up held relatively constant, and chat reference dropped from 2010 to 2012.
The majority of libraries had social media accounts:
- Almost all (93%) of the largest libraries, a little more than 4 in 5 (83%) libraries serving between 25,000 and 499,999, 7 in 10 (69%) of those serving 10,000 to 24,999, and 54 percent of the smallest libraries had at least one social media account.
- Of the 9 social networks that were analyzed, libraries were most likely to be on Facebook (93% of the largest libraries, 82% of libraries serving between 25,000 and 499,999, 68% of libraries serving between 10,000 and 24,999, and 54% of the smallest libraries). From 2010 to 2012, the smallest libraries had the biggest jump in adoption of this social network, from 18 percent to 54 percent.
- Other common social networks were Twitter (84% of the largest libraries were on this network) and YouTube (60% of the largest libraries). Flickr was also common, however, it has decreased in all population groups from 2010 to 2012; for example, 63 percent of the largest libraries used this social network in 2010 versus 42 percent in 2012.
- Close to one-third (31%) of the largest libraries were on Foursquare, 23% were on Pinterest, and 8 percent each were on Google+ and Tumblr.
- The largest libraries were on an average of 3.54 social networks out of the 9 included in the analysis, whereas the smallest libraries averaged less than 1.
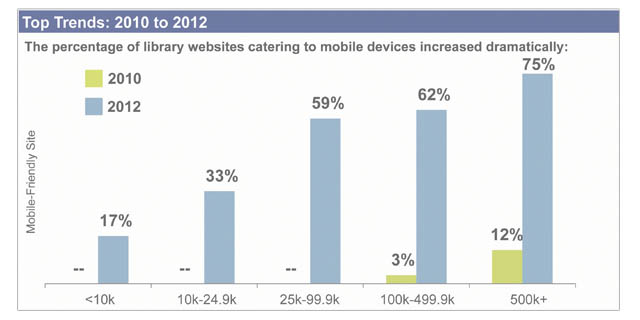
Since 2010, the number of libraries that catered to mobile devices has increased dramatically:
- Three-fourths of the largest libraries, about 3 in 5 libraries serving between 25,000 and 499,999, one-third of libraries serving between 10,000 and 24,999, and 17 percent of the smallest libraries offered some type of mobile-friendly website access. In contrast, in 2010, 12 percent of the largest libraries, 3 percent of libraries serving between 100,000-499,999, and no libraries serving less than 100,000 offered mobile-friendly website access.
In terms of the specific type of mobile access,
- 3 in 5 of the largest libraries, about half (48%-52%) of libraries serving between 25,000 and 499,999, 1 in 5 (19%) libraries serving between 10,000 and 24,999, and 2 percent of the smallest libraries offered mobile applications (apps);
- 2 in 5 (41%) of the largest libraries, about one-fourth (23-25%) of libraries serving between 25,000 and 499,999, 1 in 5 libraries serving between 10,000 and 24,000, and 14 percent of the smallest libraries had mobile versions of their sites (i.e., the URL redirected to a mobile version of the website when viewed on a mobile device); however,
- just 9 libraries used responsive design.
Related information:
- PDF version of this Fast Facts.
- Closer Look report, which contains detailed information about the national and Colorado-specific findings.
- Infographic summarizing study highlights.
- U.S. Public Libraries and the Use of Web Technologies webpage, which contains all published information from the 2008, 2010, and 2012 studies.