
Have you ever come to a trail intersection and had a hard time deciding which way to choose, not because you are lost, but because both options are great? You want to reach the scenic overlook promised up the first trail but also to find the clear alpine lake hidden a couple miles in the opposite direction. It’s not an easy choice when both options have something fantastic to contribute. Well, at LRS we are just as excited to help you choose the research design path that is the best fit for you. We are also happy to share that, if you are stuck between a qualitative or quantitative approach, you don’t necessarily need to choose just one!
Through our exploration of evaluation and research for libraries, we’ve covered a lot of ground. This month, as we all reflect on what we are thankful for, it also feels like a fitting time to take a look at the path we’ve already paved through the evaluation process and introduce our last topic for 2022 – a crossroads of both qualitative and quantitative data – mixed methods research design.
Where have we been?
This LRS blog series, Between a Graph and a Hard Place, first introduced qualitative and quantitative data in the post, “Ready to meet your (data) match? Introducing number data and story data.” In this post we stressed the importance of picking the right type of data to collect based on your research question, with quantitative (number) data being best at answering the types of questions starting with “how much” or “to what extent,” and qualitative (story) data best at answering questions starting with “why” or “how.” We also addressed the fact that there can be aspects of your research question that necessitate qualitative data collection and other aspects that require quantitative data. This is where a combined (mixed methods) approach to your research can give you the best of both worlds.
After introducing qualitative and quantitative data, it was time to learn more about data collection methods. The four methods we discussed were surveys, observations, focus groups, and interviews, and we explained which type of data (qualitative or quantitative) is produced by each data collection method. Mixed methods research designs were hinted at in a couple of these posts to make it clear that you are not limited to one data collection method or one type of data when trying to answer your research question. In fact, if carefully applied, multiple types of data can work together to strengthen your findings. The more paths you decide to follow the more possibilities you have to discover and learn from your data!
Where are we going?
If we have the time and resources to collect both types of data and think both are necessary to fully answer our research question, we still need to be strategic in planning our next steps to prepare for a mixed methods design. Just because both the qualitative and quantitative paths can be followed, does not mean that we ditch the trail altogether and blunder blindly into the woods to get lost. Mixed methods design requires a map, and you should choose a route carefully and proceed intentionally.
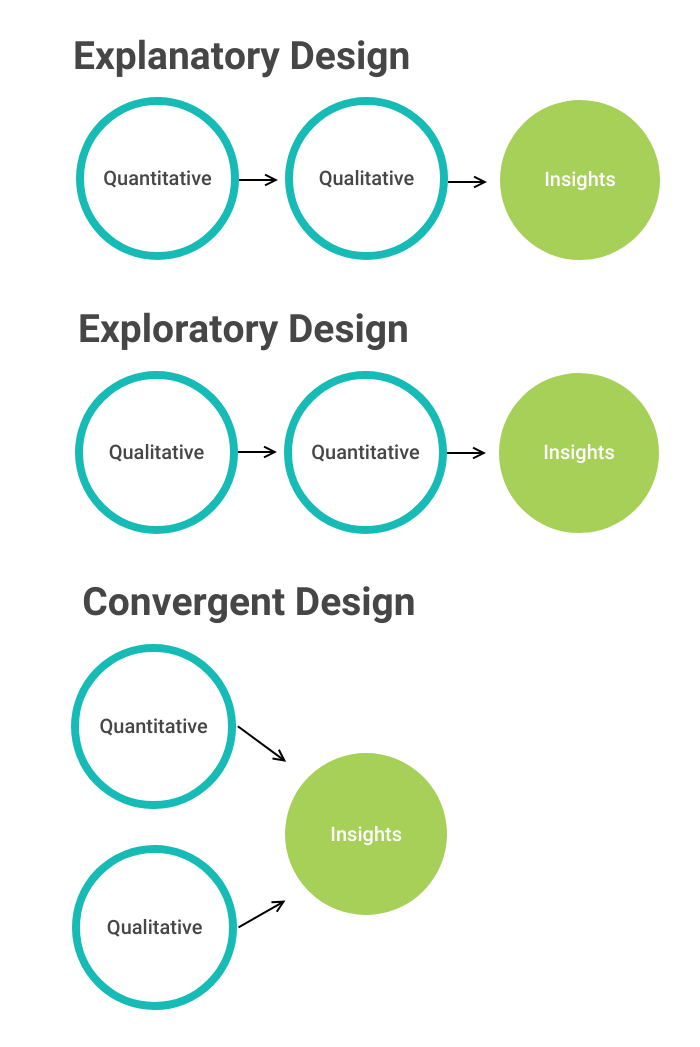
The three common paths for mixed methods design that we will introduce in this post are called explanatory, exploratory, and convergent. The order in which you collect the qualitative and quantitative data is a primary difference in these designs. Your research question should inform which order you choose because this sequence directly affects how the data types will work together to answer your research question. Let’s take a quick look down each path, so you can pick the best route to answer your research question.
Down Explanatory Avenue
An explanatory design means that you collect quantitative data first. Then, afterwards, you collect qualitative data in order to explain the “why” or “how” behind your initial quantitative findings. This approach may be useful in answering a question such as, “Has attendance for summer programs increased since community input was incorporated in the planning stage?” Quantitative data, or the number of people who attended, is the main focus of this question, so it’s logical to start by measuring to what extent (if at all) summer program attendance has increased since community input was incorporated.
Once you have gathered these numbers (say attendance has increased by 40%) you can use them to inform the second, qualitative component of your project with the goal of explaining why this increase occurred. During your qualitative data collection you may hear impactful stories from people who find the programs more relatable or feel empowered when asked for their input. These narratives explain the increase in attendance and strengthen your findings. There is an emphasis on the increased attendance, or the quantitative data that is collected first, but overall the two types of data support each other and work together to answer your question.
Trekking the Exploratory Trail
Exploratory design flips the sequence of data collection, so you collect qualitative data first, in order to explore a topic, before you dive into quantitative data collection. We shared an example of exploratory research in this post on focus groups, where we explain how you may want to conduct focus groups before administering a survey on a complex topic to ensure you are asking the right questions and providing relevant answer options. Both types of data are still working together to answer the same question, but in this case, the qualitative data is being used to point you in the right direction before you move into quantitative data collection.
For example, you might use this design if the question you are trying to answer is, “What barriers most often prevent people from attending summer programing?” To answer this question it is important to first understand the social and economic factors involved. If you are unaware of certain barriers that may exist, you could put out an uninformed survey that overlooks a community’s lived reality. Providing a safe space for people to discuss existing barriers maintains a focus on the stories and perspectives of your participants (qualitative data) before you eventually identify which barriers occur most often (quantitative data). If conducted correctly, this exploratory approach may be used to extrapolate qualitative findings from a small sample size to a larger population.
Covering the Convergent Course
The final approach to mixed methods research we will introduce today, convergent design, allows you to collect qualitative and quantitative data at the same time. This path can be used in situations where you don’t necessarily need to collect the quantitative or the qualitative data first, but you know that both will be equally valuable in answering your research question. Explanatory design tends to prioritize quantitative data and exploratory design tends to prioritize qualitative data, but in convergent design the two data types hold equal weight. This strategy can also save you some time because your data collection takes place simultaneously.
Let’s say that you want to learn about people’s past attendance to summer programs, but you are conscious of the time commitment you are asking from your participants. Instead of completing two rounds of data collection for each data type and having to follow up with your participants a second time, it makes sense to ask for both qualitative and quantitative data at once. You may ask, “Which of the following programs have you attended in the past?” Then you might also ask, “If you have attended past programs, why did you choose to attend?” The first question yields quantitative data because you can check how many programs a single participant attended as well as which programs were attended most often. The second “why” question will give you qualitative data. In this case, there is no need to collect one of these data points before the other.
On the Horizon
In all studies with a mixed methods design an important element to consider is how you are going to incorporate the two data types together. A mixed methods approach means more than just collecting both types of data. You also need to identify where and how to best fit them together, or in other words, integrate your findings. We will discuss this in our next post as well as share what is in store for Between a Graph and a Hard Place in 2023!
LRS’s Between a Graph and a Hard Place blog series provides instruction on how to evaluate in a library context. Each post covers an aspect of evaluating. To receive posts via email, please complete this form.