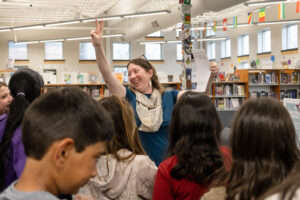
View the latest 2022 Public Library Annual Report (PLAR) data on the breakdown of library expenditures and learn about stacked bar charts.
Are MLS degrees required to work in Colorado public libraries? Check out these pictogram charts to find out!
See how Colorado public library annual report (PLAR) data compares to public library survey data from across the nation.
Explore library square footage through a type of data visualization that shows data with the area of rectangles.
Building bubble charts comes with challenges but if done well can produce fun, engaging, and powerful visualizations.
Strengthen your data analysis by correctly calculating and communicating percentage change.
Sharing stories about building resilient communities in the face of the climate crisis
Stay informed about the latest number of reported book challenges and the implications behind increasing challenges.
In honor of Pi Day LRS is showcasing Colorado public library partnerships through circular data visualizations!
Investigate the correlation between libraries’ materials expenditures and circulation while reviewing scatter plots.