Did you know that some library locations change their hours in the summer? When school is out, summer reading is in full swing, and many people’s routines shift, it can be beneficial for libraries to adjust their hours in response. In addition to changing weekly schedules, there may also be instances when some libraries open as cooling shelters outside of normal operating hours.
In Colorado, around 14% of library locations reported that their weekly public service hours varied in 2024. The Public Library Annual Report tracks how many total hours libraries are open per week, how many evening and weekend hours open, and the general schedules of each library location. Of the 40 Colorado public library locations that reported varying weekly hours, nine provided us with two different weekly schedules depending on the season. In this post, we will focus on the schedules of these nine libraries to determine when they’re generally open, when they’re less likely to be open, and what scheduling adjustments they’re making during the summer. Of course, libraries are also full of activities outside their regular hours for activities like teen nights or special presentations. The PLAR doesn’t capture the time that goes into all these unique services, but it can give us a baseline of operating hours. To compare these baseline regular and summer schedules, we’ll use a type of chart aptly named for this time of year: a heat map.
Heat Maps
Heat maps help show patterns, trends, or outliers in a data set through color shading that indicates where data falls along a scale as well as its location within a table or map. They are often literal maps that tie data to geographical locations, but there are a variety of ways that heat maps can appear including in calendar form as in Figure A below. Like all types of visualizations, heat maps can go wrong quickly if not constructed carefully. While they can be a visually appealing way to communicate the general gist of a large data set, they do not excel at conveying precise information. Other potential downfalls of heat maps include misleading depictions of data if the scale is skewed or misinterpretation of data if not enough context is given.
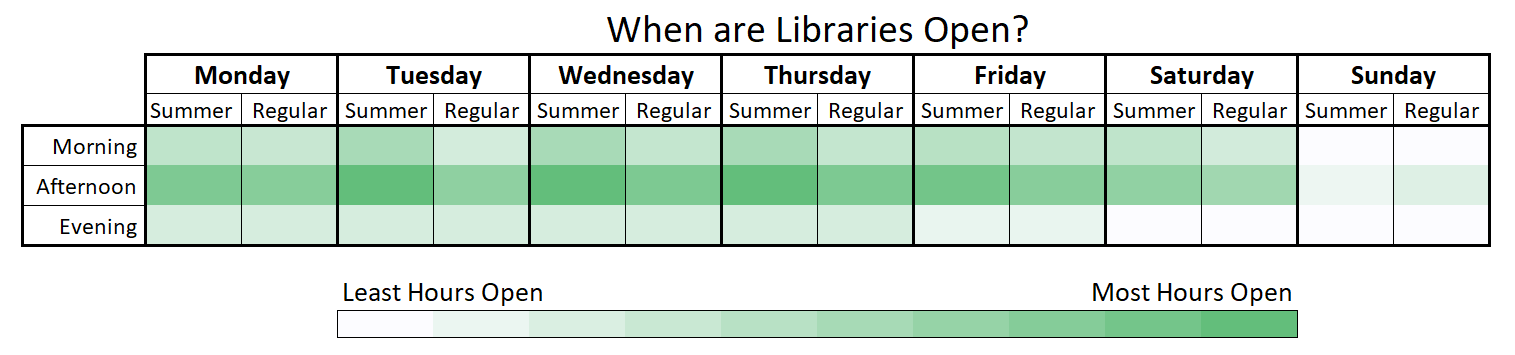
Since color is an essential component of heat maps, the colors you choose to use determine whether readers can interpret the chart and how they interpret it. For example, the red to green scale used in Figure A below, is not accessible to people with color vision deficiencies that make it difficult to differentiate between green and red. I chose to use this scale because of the connotations that the colors red and green have. Red may be interpreted as negative, and in this case it is used to show when libraries are generally closed. On the other hand, green is used to show when libraries are generally open because it often carries a positive connotation. With all charts, and especially those that use color combos which may be challenging for some readers to interpret, it is important to create an alternative way for readers to access the same information that is in the chart. In this case, I’ve provided a detailed description of what the chart conveys in the text below the chart as well as alternate or “alt” text attached to the image of the chart. I’ve also included Figure B, which is an example of the same heat map with more accessible color shading.
Figures A and B below were created in Excel to compare the two schedules of library locations that shared different summer library hours and show when these libraries are often open or closed throughout the week. The “regular” schedules were sometimes specified as the schedule in use from Labor Day to Memorial Day, and sometimes referred to more generally as the school year schedule. If this post has sparked your interest in creating a heat map in Excel, and you would like more detailed instructions on how to do this, please don’t hesitate to reach out to Library Research Service by emailing lrs@lrs.org.
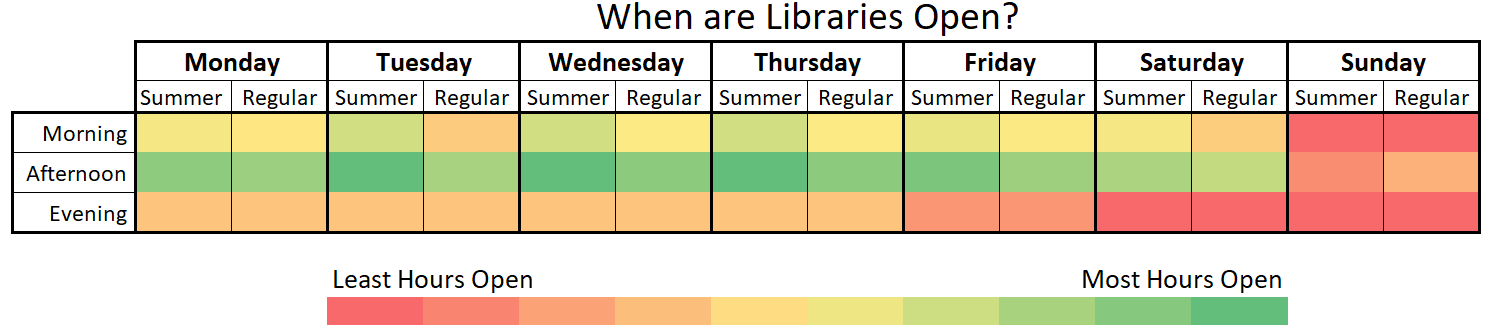
Figures A and B above depict the same data in two different color schemes. They both show that the nine Colorado libraries in this data set have the most open hours in the afternoon, and specifically, weekday afternoons. When comparing the top (morning) row to the bottom (evening) row it can also be seen that these libraries are generally more likely to be open in the morning than the evening. Libraries were open the least on Sunday mornings and Saturday and Sunday evenings.
Summer hours and regular hours are also compared for each day of the week. The subtle color differences across the first and second rows show that libraries have slightly more hours in the summer during mornings and afternoons, though Sunday is an exception.
Involving Artificial Intelligence (AI)
It would have been terribly tedious to manually determine the number of hours that each library location is open in the morning, evening, and afternoon for both summer and school-year schedules. Schedules were written using different abbreviations for the days of the week and in different orders making them particularly difficult to accurately decipher. Since a library’s hours are meant to be shared publicly, reading these schedules seemed like the perfect job for a large language model (LLM) AI.
Sharing the operating hours of nine libraries and asking the AI questions such as, “How many summer Monday morning hours are in these schedules?” yielded some correct answers. I checked the first several prompts I ran through AI and found that, in a few cases, its responses helped me catch my own mistakes when calculating hours by hand. However, there were also mistakes made by AI. For instance, if a library indicated the addition of a few hours in the summer, AI might interpret this as the entire summer schedule on its own. Sometimes asking the same question with the same data yielded different responses. AI seemed to adjust its calculations as it tried to further interpret what I was asking. I ran the same prompts through both ChatGPT and Microsoft CoPilot and the two systems sometimes gave me different answers.
After seeing that AI was not reading the schedules correctly in many cases, I realized I would have to do some extensive cleaning of the data. I started by fixing small errors within the text such as typos or clarifying ambiguous descriptions but still received inaccurate results from AI. I ended up rewriting the nine schedules into a standard format, something that would be too time consuming to do with the entire data set of all Colorado public library schedules. It was only after standardizing these schedules that I began to receive responses from AI that consistently matched my own calculations as I spot-checked its work, which finally gave me the confidence to use AI’s answers in the heat map.
This was a great opportunity to test the capabilities of current AI with a fairly complex data set, and I learned a lot in the process. Heat maps excel at showing general patterns rather than exact values, so even though I did not check each calculation, I am confident that the data the AI produced could be used to create an accurate color scheme for the charts above. However, testing the AI’s responses and then cleaning the data so it could be read accurately by AI was time consuming. I am far from an expert on AI, but at LRS, we hope to continue incorporating this powerful tool into our work when appropriate and sharing what we learn with you along the way.
Shoutout to All Library Data Gatherers!
To wrap up, I wanted to give a shoutout to all the library staff who inspired this post back in June by participating in the popular discussion on Libnet about whether libraries across Colorado were going to be open on Juneteenth. The large number of responses to this question caught our attention at Library Research Service, so of course, we saw an opportunity to gather data. The best part – we didn’t have to go any farther than our own inboxes to collect it! Although Juneteenth 2025 has come and gone, it’s a relatively new state holiday in Colorado (made official in 2022), so libraries might still be deciding whether to add it to their list of holiday closures. After a tally from the Libnet thread, we found that, of the 28 libraries that responded, around 61% were closed for Juneteenth and 39% were open.
Looking ahead, for all who are taking the day off to celebrate this 4th of July, we hope you have a relaxing, fun, and safe holiday weekend. Thanks for reading!
LRS’s Colorado Public Library Data Users Group (DUG) mailing list provides instructions on data analysis and visualization, LRS news, and PLAR updates. To receive posts via email, please complete this form.