EdBuild, a research organization that promotes equity in public schools, recently released the results of their analysis of 2016 public school funding on the national and state levels. The purpose of the analysis was to examine this funding based on racial and socioeconomic characteristics.
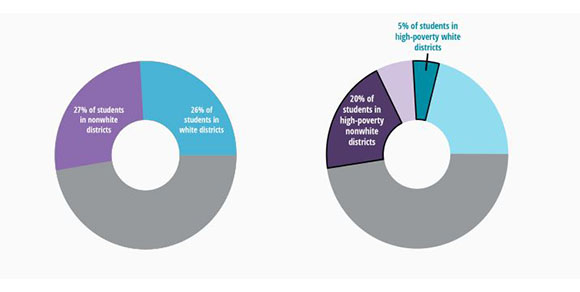
They found that, despite decades of desegregation efforts, more than half of students still attend schools that are located in either predominantly white (26%) or predominantly nonwhite (27%) school districts. Nationwide, white school districts received $23 billion more in funding in 2016 than school districts that mostly served students of color. This means that the average white school district received $13,908 for every student, while nonwhite districts received $11,682 per student.
The racial divide becomes more apparent in racially concentrated high-poverty school districts. Of all the students in the U.S., 1 in 5 (20%) are enrolled in a high-poverty nonwhite school district, while only 1 in 20 (5%) are enrolled in a high-poverty white school district. High-poverty nonwhite districts tend to be larger than their white counterparts, serving an average of 10,500 students compared to an average of 1,500 students. There are 6 times more predominantly white school districts than nonwhite districts in the U.S., offering white districts more opportunity for funding advocacy in state legislatures.
Racial disparities also exist in our home state of Colorado. Nearly a third (31%) of students are enrolled in racially isolated school districts. About 1 in 10 (12%) Colorado students are enrolled in a high-poverty nonwhite district, while only 1% of students are enrolled in a white district with the same financial issues. On average, nonwhite districts have 16% less funding than white districts. This means that a Colorado student attending school in a high-poverty nonwhite district receives $2,770 less than a student in a high-poverty white district.
The full report can be found here.
Note: This post is part of our series, “The LRS Number.” In this series, we highlight statistics that help tell the story of the 21st-century library.