
If you walk into a hardware store, you might see an entire aisle of screws—short ones, long ones, phillips head, flat head, ones with weird little anchors on the ends. They might all be screws, but they each serve a specific purpose—for wood or cement, for different screwdrivers, for thick or thin materials. It’s the same with data visualizations. They might all be charts, but pie charts, bar charts, and line charts all serve a different purpose. When data visualizers use the wrong one (often unintentionally), you’re left with a chart that doesn’t really make sense.
Below are charts using the same data—the number of reference questions, by topic, asked each month from January through April. Let’s take a look at what information we can gather based on how those data are displayed in the visualization.
Line Charts
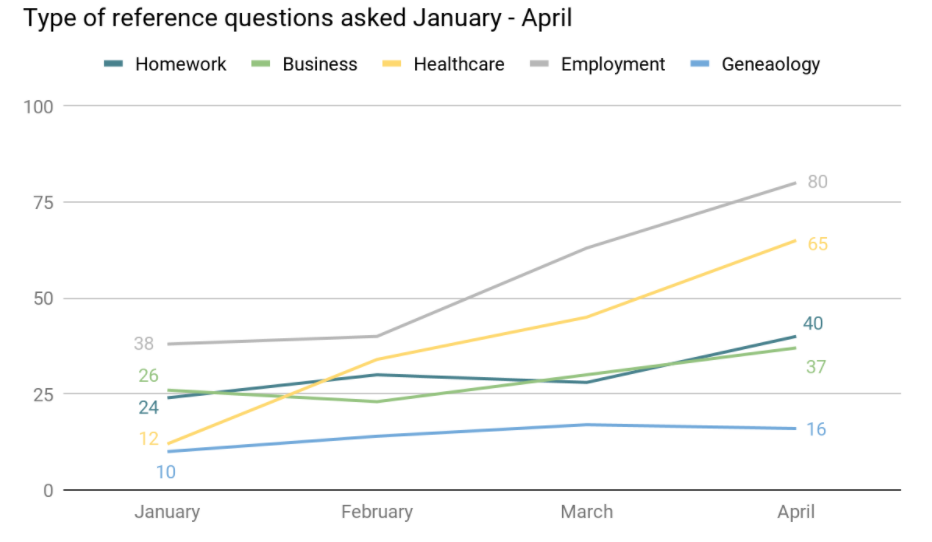
Line charts are commonly used to track changes over a period of time. They have a y-axis (up and down) and an x-axis (left to right) to plot two different variables. While a bar chart can also be used for this purpose, a line chart is particularly helpful when smaller changes exist or when you’re comparing changes over the same period of time for more than one group, like in the chart above.
Here we can see that something might have happened in February to cause healthcare, business, and employment to all increase. Homework questions dropped off a bit though. Did schools give kids time off before online learning started? We know to investigate those questions because the line chart helps us identify trends.
Pie/Donut Charts
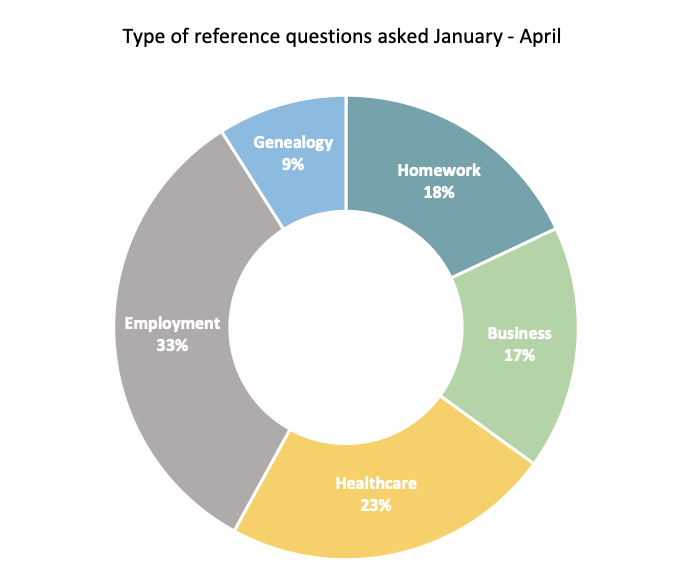
Pie/donut charts should only be used to compare parts to a whole. Each category is associated with a slice of the pie which corresponds to that category’s proportion (or percentage) of the total. We can see that the majority of questions asked during this time period were about employment because it’s the largest slice. The least amount of questions were about genealogy. However, there’s a lot we can’t see. For instance, we have no idea how many reference questions in each category were asked in each month. We can’t see if there was a spike in healthcare questions in February when flu season hit its peak.
If you added up the values of each slice, they would equal 100 percent because each slice of the chart is determined by dividing the whole (total number of reference questions) by the part (question topic). As a reader, a huge red flag should go off if they don’t (unless the chart states it’s due to rounding). Sometimes pie charts will only have a legend that tells you what each slice represents, rather than data labels. In these cases, it’s even harder to discern how slices compare to one another because our brains are terrible at making spatial comparisons between circular areas. In general, pie charts should not contain more than five slices. When they do, it becomes difficult to read and some slices might be so small that you can’t interpret them anyways, rendering the data visualization pretty much useless.
Bar Charts
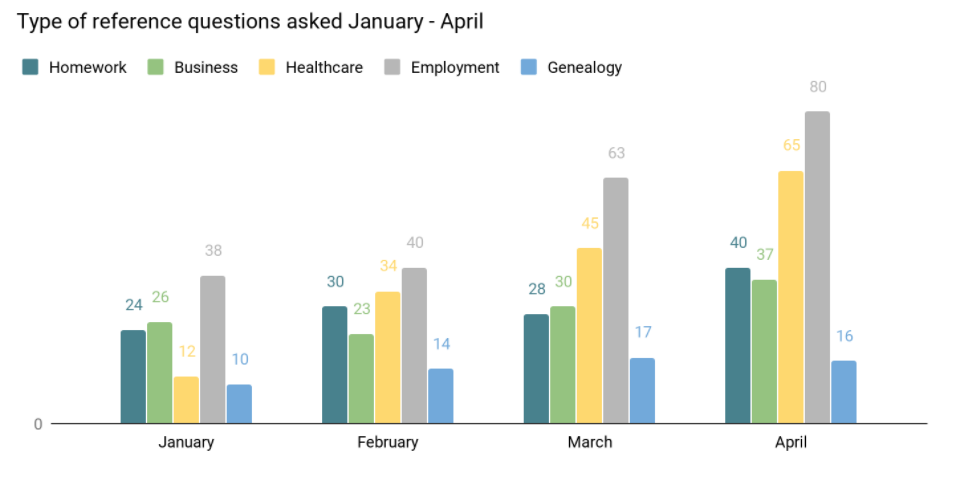
Bar charts are used to compare things between different groups or to track changes over time. They can also be used to present data that sum to more/less than 100 percent because, unlike pie charts, they aren’t limited to presenting parts to a whole. Like a line chart, they have an x-axis and y-axis, but bar charts aren’t confined to using a unit of time across the x-axis. For instance, a bar chart could use a demographic variable like age group. They can also be stacked, like in the example below. 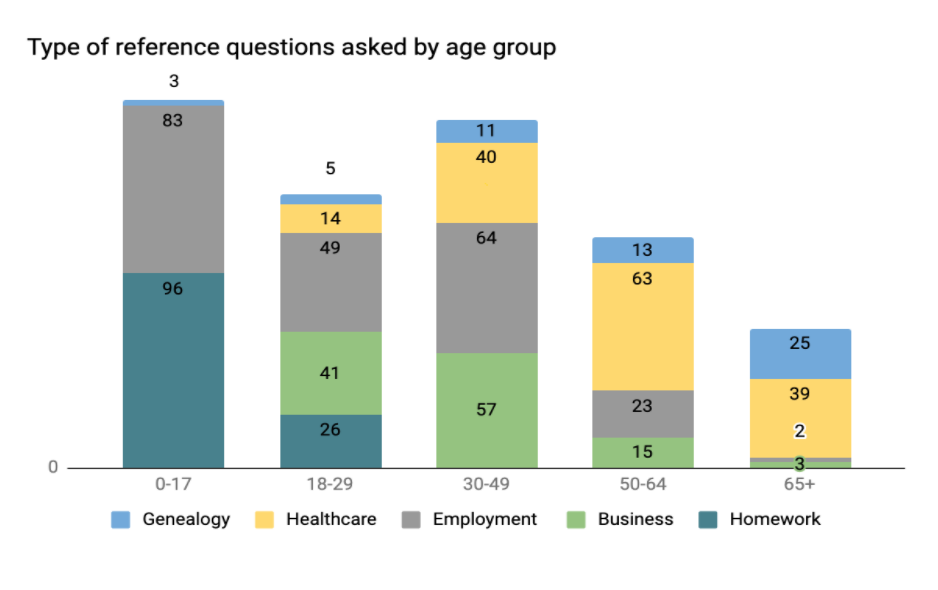
Conclusion
When looking at charts, think about whether the one the creator chose makes sense for the data story they’re trying to tell. Are they talking about changes over time, comparisons between multiple groups, or how much something makes up of the total? If the story doesn’t match the visual, be careful to draw any conclusions based on the chart. In addition, 3D renderings of any of these charts are likely to cause distortion and be visually inaccurate, even if it’s the right type of chart for the job. Here’s a nifty cheat sheet (https://www.workshopdigital.com/wp-content/uploads/2016/07/chart-comparison.png) that always helps me recall when each chart should be used, and some important notes to remember:
- If it’s talking about something changing over time, it should be a line or bar chart
- If it’s talking about multiple variables, it should be a bar chart
- If it’s talking about comparing something to the total, it should be a pie chart.
LRS’s Between a Graph and a Hard Place blog series provides strategies for looking at data with a critical eye. Every week we’ll cover a different topic. You can use these strategies with any kind of data, so while the series may be inspired by the many COVID-19 statistics being reported, the examples we’ll share will focus on other topics. To receive posts via email, please complete this form.