Welcome back to The Public Library Blueprints! After a short hiatus in April, this post tackles a topic that can trip up even practiced researchers. Finding the percentage change between two numbers can be helpful if your data consists of two related numbers, where one is an original or past value and the other is the new or updated number. It is also useful for comparing changes between two sets of numbers without being distracted by their actual values. While calculating percentage change can be done by hand with a short formula, and there are many online calculators that will do the math for you, there are some important principles to bear in mind that will help you ensure percentage change is communicated accurately and effectively.
We encounter percentage changes fairly often in everyday life. Sales are one of the first examples that come to mind. If you find the summer sandals you’ve been looking for on sale for 30% off, that sounds like a great deal, but it’s still helpful to know what the final price of the sandals will be. In this case, you’ve been given the percentage change already (a 30% decrease in price), and you are looking for the final price after this discount is applied to the original price. When calculating percentage change to analyze and present data you likely have the original and new numbers already and want to find the percentage change between them. Just as you might do if, for example, a friend tells you that their sandals were originally $40 dollars but they got them for $26, and now you’re curious who found the better sale. Your friend wins this one, because their sandals were 35% off. Here’s how to find out:
| (Final Value - Initial Value) ÷ | Initial Value | × 100 = PERCENTAGE CHANGE (26 - 40) ÷ | 40 | × 100 = -35 |
|---|
Returning to research, let’s talk about how, why, and when to incorporate percentage change into your data analysis. Assuming your data set already contains the original and new numbers, calculating the percentage change between these numbers can tell you and your audience more about their relationship. As with all Public Library Blueprint posts, we’re turning to the Public Library Annual Report (PLAR) data to learn more.
Revealing Circulation Trends
Circulation of different types of public library materials has fluctuated significantly in the past few years, likely due to many factors including the field’s response to COVID-19 and the increased need to provide a wide variety of resources in new and innovative formats. In 2016, the PLAR began compiling data on both physical item circulation and the circulation of electronic materials. These two numbers make up a library’s total circulation. Comparing the statewide total of each category from 2016 and 2021 shows that physical item circulation across the state dropped by 19,990,973 and circulation of electronic materials rose by 8,367,156. What is your initial impression when seeing these numbers? Personally, these numbers are so large that it’s a challenge to wrap my head around them. I also noticed that total physical item circulation dropped more than twice as much as total electronic material circulation grew. This may be discouraging, but there is some key information that we’re missing. Total electronic material circulation started at the much smaller value of 7.2 million in 2016, compared to total physical item circulation, which started at 56 million in 2016.
Using the 2016 and 2021 statewide totals of electronic material and physical item circulation to calculate the percentage change for both categories sheds more light on these preliminary circulation trends. The formula to calculate percentage change is (Final Value – Initial Value) ÷ | Initial Value | × 100 = PERCENTAGE CHANGE.
The first step to calculating percentage change is to identify which value is the initial value, which in this case is the 2016 total circulation of electronic materials, and which is the final value, or the 2021 total circulation of electronic materials in this example. You then take the final value, subtract the initial value, divide the result by the initial value, and lastly convert the decimal to a percentage by multiplying by 100. Plugging in the PLAR data on total circulation of electronic materials produces the following: (15,607,652 − 7,240,496) / 7,240,496 ×100 = 116
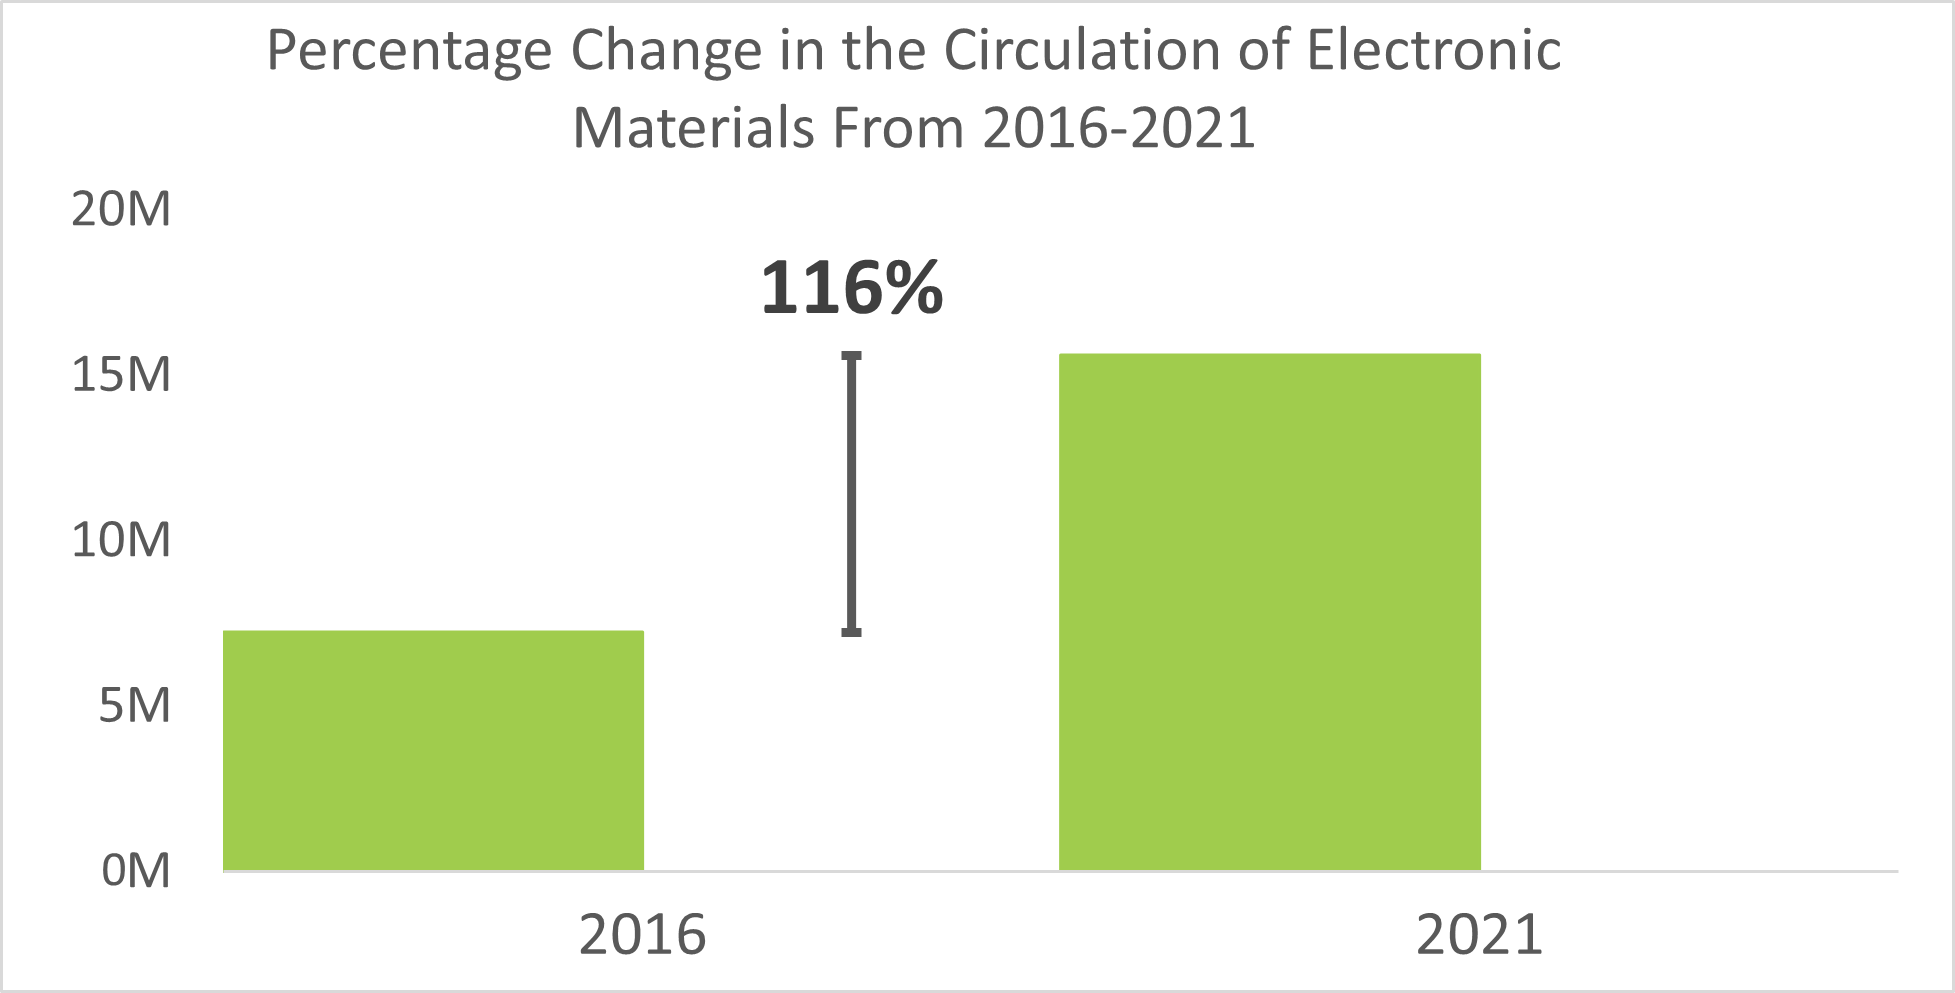
From 2016 to 2021 total circulation of electronic materials more than doubled with a 116% increase. On the other hand, plugging total physical item circulation into the same equation produces -36, which means statewide physical item circulation dropped 36%. (If the percentage change formula produces a negative number there was a percent decrease, and a positive number indicates a percent increase.) Finding that the total circulation of electronic materials has increased 116%, while physical item circulation has decreased but only by 36%, helps us better interpret the data and understand the changes taking place in public library circulation. Instructions on how to create a percentage change chart in Excel, such as Figure A, can be found online.
| A word of warning – once an initial percentage change is calculated, the reverse number is not the same. For example, if a library has four staff members and loses one, that's a 25% decrease in staff. But, if that staff member wishes to return, that would not be a 25% increase in staff because the new initial value currently stands at 3. Increasing the staff to 4 members again would actually represent a 33% increase in staff. The main thing to remember here is that, because the initial value is different, percentage changes also differ when something is taken away and then returned or vice versa. |
|---|
In the example above, calculating and sharing percentage change is meaningful to the data, but there are times when it can overcomplicate the intended message or cause confusion. For instance, it would be irrelevant to calculate percentage change between 2021 physical-item circulation and 2021 circulation of electronic materials because these numbers are measures of separate variables, so one does not directly lead to the other. If your data does fit the framework for percentage change by consisting of a single variable with “old” and “new” values, it’s still important to consider whether a percentage change is the best way to communicate the rate of change. Oftentimes there is language that is more user friendly for your audience than sharing the exact percentage of change. Returning to the circulation of electronic materials, for example, which sentence is initially more meaningful to you?
The circulation of electronic materials more than doubled from 2016 to 2021.
or
There was a 116% increase in the circulation of electronic materials from 2016 to 2021.
Even though the second sentence is more precise, it might hold less meaning to an audience that is interested in a general overview of the data, not a math lesson. Most people immediately understand terms such as doubled, tripled, or halved, but it may take them longer to realize that these correspond to a 100% increase, a 200% increase and a 50% decrease respectively. It’s important to consider whether the precise percentage is necessary for communicating change or if you can accurately convey the same message through more universally understood terms.
Lastly, when two data points are already percentages, a common mistake is often made. When working with percentages, the term percentage points should be used to describe the difference between these percentages. For example, in 2016 the circulation of electronic materials made up 11% of total Colorado public library circulation, but in 2021 it had risen to 30% of total circulation. It is tempting to find the difference between these two percentages and call that the percentage change, but percentage change describes a rate of change, and in this case, you are only describing the amount of change between these two percentages. It’s correct to say that the circulation of electronic materials was 11% of total circulation in 2016 and then increased 19 percentage points to 30% of total circulation in 2021. But it would be incorrect to say that there was a 19% change between 11% and 30% because the percentage change between these two numbers is actually 173%. Correctly identifying what you are measuring and distinguishing between percentage points and percentage change when presenting your data is an easy way to avoid this mathematical error.
Final Thoughts
Whew! That was quite a bit of math. Thanks for sticking with it! Remember, there are many online calculators that can help calculate percentage change, but it’s also helpful to understand the process. Speaking from experience, it’s easy to mix up the old and new values, but if you understand the process you’re much more likely to catch those mistakes.
Stay tuned for our next Public Library Blueprints post, where we’ll take a break from data analysis to explore another data visualization method.
LRS’s Colorado Public Library Data Users Group (DUG) mailing list provides instructions on data analysis and visualization, LRS news, and PLAR updates. To receive posts via email, please complete this form.