Small multiples certainly struck me as a confusing term the first time I heard it, so let’s jump straight into an explanation of what we’ll be talking about in this post to keep it short and sweet. Small multiples are a type of chart that consists of a compilation of miniature charts. Small multiples may contain bar, line, or pie charts among others, but the type of chart will be the same throughout a small multiples visualization. For example, Figure A below only contains bar charts, and we wouldn’t want to interrupt that with a different type of chart, or even a different bar chart layout. Keeping everything consistent is what makes small multiples easy to read. Creating a small multiples chart is a great way to break down multiple dimensions of information without overcomplicating or overcrowding a single chart. Let’s take a closer look at one!
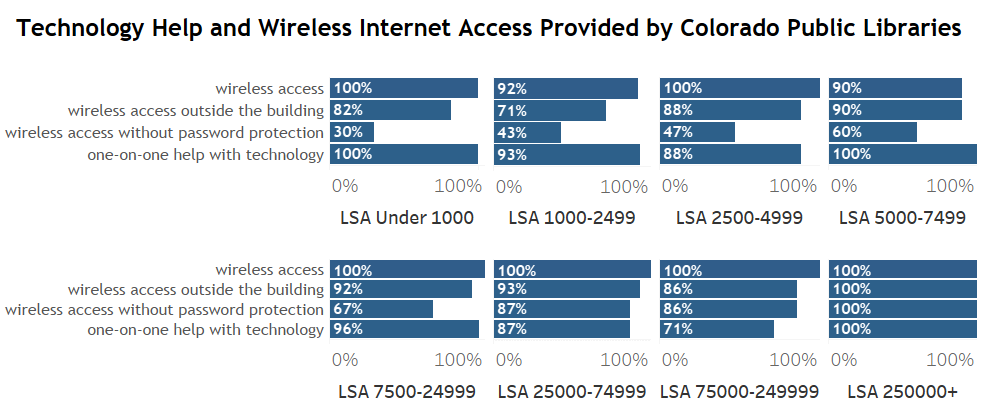
Figure A shows the percentage of Colorado public libraries from eight Legal Service Area (LSA) categories that provide certain technology access and services. It looks at whether libraries provide wireless internet access, wireless internet access outside the building, wireless internet access without password protection, and one-on-one help with technology. It should be noted that the number of libraries in each LSA category varies and not all libraries responded to each of these four questions on the annual Public Library Survey in 2022.
I chose to depict this data through a small multiples chart because, while it would be possible to show all of this data in one complex chart, it would likely take more time for a viewer to interpret this single chart. Humans’ attention span has been decreasing and is now estimated to be around just eight seconds! If those seconds are spent trying to figure out what a data visualization means, it’s likely that the main takeaway of the visualization won’t be recognized at all. A series of small, simple charts allows the audience to quickly and easily decipher what the first chart is showing and then effortlessly apply this knowledge to each of the following charts. Small multiples can also help to eliminate the use of a chart legend. While legends are often a necessary chart component, they can also be cumbersome for an audience to decipher.
It may take more than eight seconds to absorb all the information in Figure A, but it quickly becomes clear that generally a higher percentage of libraries with larger LSA populations provide wireless internet access outside the building and wireless internet access without password protection. The percentage of libraries that provide one-on-one help with technology fluctuates across LSA populations and never falls below 71%. Most libraries provide wireless internet access regardless of LSA population.
Best Practices for Small Multiples
There are a few guidelines to follow when building small multiples. Choosing a simple chart type to repeat is key, and although it can be tempting to add different colors, most of the time this isn’t necessary in small multiples and will only be distracting. Also, the same data and data placement should be used across each chart. Figure A could easily be misinterpreted if the data in the second row of charts was ordered differently than the top row. The charts should also have a logical order. Obviously, it would be misleading to place the “LSA 1000-2499” chart before the “LSA Under 1000” chart. All in all, if created with care, small multiples help your audience focus on the message behind the charts, instead of how to read them.
The small multiples chart above was created in Tableau. If you would like to create small multiples but need some help getting started, please reach out to lrs@lrs.org. Thanks for reading!
LRS’s Colorado Public Library Data Users Group (DUG) mailing list provides instructions on data analysis and visualization, LRS news, and PLAR updates. To receive posts via email, please complete this form.