We say a picture is worth a thousand words, but when it comes to data visualization, it’s up to the designer to make sure their visual paints a clear picture. If adding yet another bar, line, and/or pie chart to your reports is starting to feel a bit boring, pictogram charts may be an engaging alternative for you. Pictogram charts (also known as pictographs, pictorial charts, picture charts, or icon charts) use simple, small icons to display data in more memorable, meaningful ways. They can even increase the accessibility of your data visualizations by crossing language and cultural barriers. Pictogram charts are better at helping an audience understand and remember a statistic rather than rigorously conveying large amounts of data. If there are a few key facts you want people to take away from your data visual, pictograms can help your audience retain them even after they’ve walked away. And isn’t that the primary goal of data visualizations; to convey information in a way that sticks with people?
An effective, memorable pictogram chart could be worth a thousand words, but in this post, we’ll also be discussing something that is worth a whole lot more – Master of Library Science (MLS) degrees. The value of an MLS degree would take much more than a few pictogram charts to convey, so the data visualizations below will just focus on whether Colorado public libraries require staff to have MLS degrees and if so, which positions they require them for. We’ll explore this Public Library Annual Report (PLAR) data with multiple different kinds of pictogram charts and discuss the pros and cons of each, as well as traps to avoid.
MLS Required?
The annual public library survey asks Colorado public libraries whether they require an MLS for five different roles: Director, Associate Director, Department Head, Manager/Supervisor, and Librarian. In 2021, 106 libraries answered these questions. This data is shared below with icons from Infogram, and Infogram refers to this first type of pictogram chart as a pictorial bar chart.

In Figure A, half of the icon is shaded to indicate that half of responding libraries answered “yes” to at least one position when asked if they require an MLS degree. This does not mean that the other half of libraries are not hiring people with MLS degrees, just that half don’t specify an MLS as a requirement for any position asked about in the public library survey. This half shaded icon would be useless without the text to the right which explains what the coloration of the icon indicates. This explanatory text could stand on its own, but the icon serves to draw attention to the statistic, making it more memorable and indicating its significance.

Like Figure A, Figure B uses a darker shade of blue to visualize the percentage of one category in relation to the whole data set. Unlike Figure A, Figure B uses ten icons to represent all of the responding libraries instead of one. Also, since the proportion in Figure B is not 50%, it’s important to include a legend to explain what the darker color indicates, not just explanatory text.
If you look closely at Figure B, you’ll see that the right edge of the first library icon is not shaded because less than 10% of libraries required an MLS for all five positions. A pictogram chart with 10 icons may not be the best choice for this proportion (8%) because, based only on the icons, it would be easy for someone to assume at first glance that one in ten libraries, or 10% of libraries, require an MLS for all five of the positions (director, associate director, department head, manager/supervisor, and librarian). The icon chosen to represent libraries in Figure B also contains less solid color, which makes the line between dark blue and gray harder to see, adding to the likelihood that Figure B could be misinterpreted.
Do you have a favorite icon?
There’s a lot to keep in mind when choosing the best icon for a pictogram chart. Both of the icons used above, the graduation cap and the library building, relate to the information being shared. This is important because unrelated icons can be distracting and confusing. For example, a figure of a person instead of a library in Figure B would be misleading because the data consists of libraries, not people. In pictogram charts, the icon and the text work together to communicate a fact in a memorable way, which is why it’s so important to include both a clear icon and adequate context.
Even if it relates to the statistic, an icon or image that is too complex will also detract from the visual’s message. If it takes time for the audience to figure out what the icon is, the icon is probably not the right fit. Remember, an icon might be clear to you since you already know what it’s supposed to represent, but it might be confusing to people looking at it for the first time. Also, an icon could have a clear meaning to you because of your experiences and perceptions, but it might mean something completely different to someone else with different experiences. Icons can have different meanings across cultures as well. Finding the right icon will go a long way in engaging your audience and adding visual appeal to your graphic. Throughout this post, multiple different symbols for libraries and education are used. Try taking note of which icons are clearest and most visually appealing to you and why.
Are More Icons Better?
When using a single bar of icons to show the proportion of one data point in relation to the whole, such as in Figure B, it’s recommended to use no more than 10 icons. However, with more detailed comparisons of multiple values, there are times when it makes sense to use more icons. Using a grid of icons allows you to compare multiple categories that are parts of a whole. Figure C uses library icons to represent the number of libraries that don’t require their librarians to have an MLS, do require their librarians to have an MLS, and those that didn’t share data.
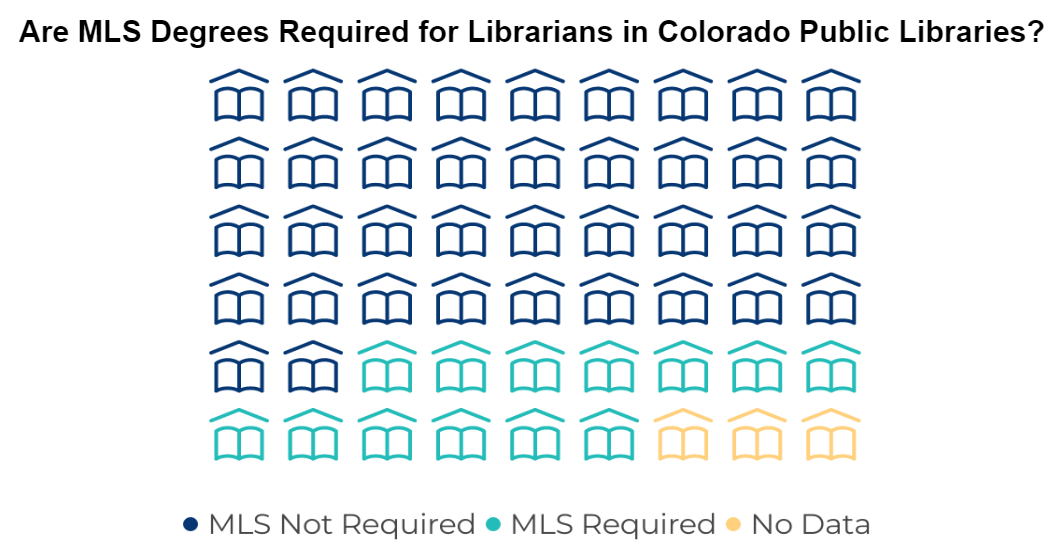
The number of icons in this style of pictogram chart does not need to be the same as your entire data set. For example, Figure C only has 54 icons, but this visual communicates data from Colorado’s 112 public libraries. The number of icons in each category is about half the actual number of libraries to represent the proportion of the whole data set. When creating pictogram charts with many icons, it is best practice to place them in a grid, so each category can be easily viewed in relation to the whole grid of icons.
Sending a Clear Message
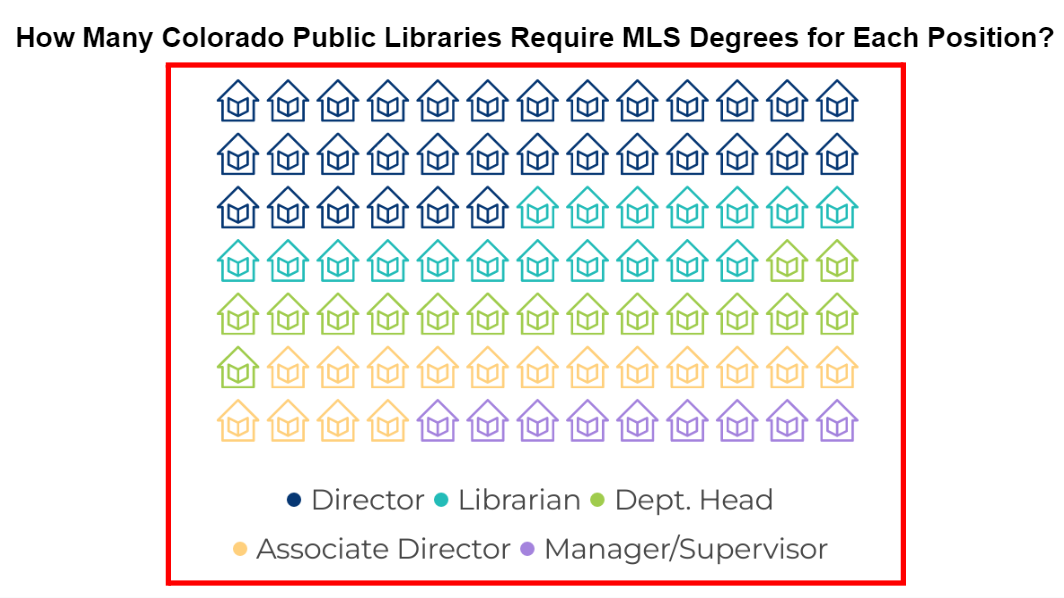
Unfortunately, it’s also surprisingly easy to create a misleading pictogram chart. Figure D shows the number of libraries that require an MLS degree for each position asked about in the public library survey. Technically the comparisons presented in this chart are correct: about twice as many libraries require an MLS for directors compared to the number that require an MLS for department heads or associate directors. However, this chart is complicated by the fact that these categories are not exclusive. A library could require an MLS for both directors and associate directors. Therefore, this pictogram chart is not accurately showing individual parts of a whole data set as the grid implies. There are better ways to visualize this data. You could choose to place multiple pictogram bar charts next to each other, with each bar displaying the data for one position, or you could use a size comparison.
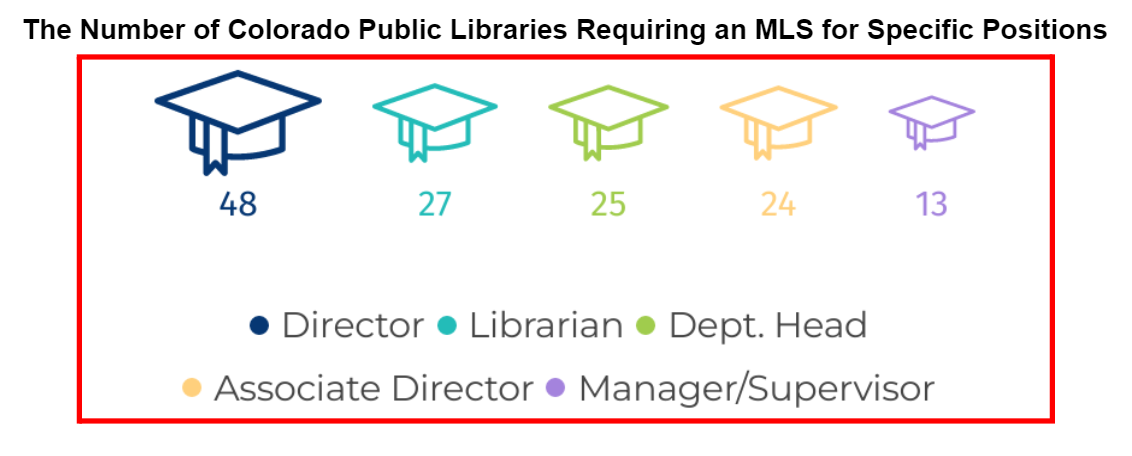
The size comparison in Figure E helps show the same data as Figure D without implying that each position is an exclusive part of the whole data set. However, Figure E isn’t necessarily the best way to present this data either. The librarian, department head, and associate director positions all have a very similar number of libraries that require an MLS degree for them, and it’s difficult to perceive this small difference in data based on the size of the icons. It would be even more difficult if the icons were not placed in order from largest to smallest or if this pictogram chart did not include data labels under the icons. Figures D and E are bordered in red because they don’t follow best practices for pictogram charts.
Pictogram charts are best at displaying the most important takeaways for your audience, so even if the difference between each position type was larger, you should still consider whether you need to display all of the data at once. Try to identify which part of the data is most meaningful to your audience so you can focus your visual on it. For example, Figure F focuses on only three leadership positions in libraries and the percentage of libraries that require an MLS for these positions.
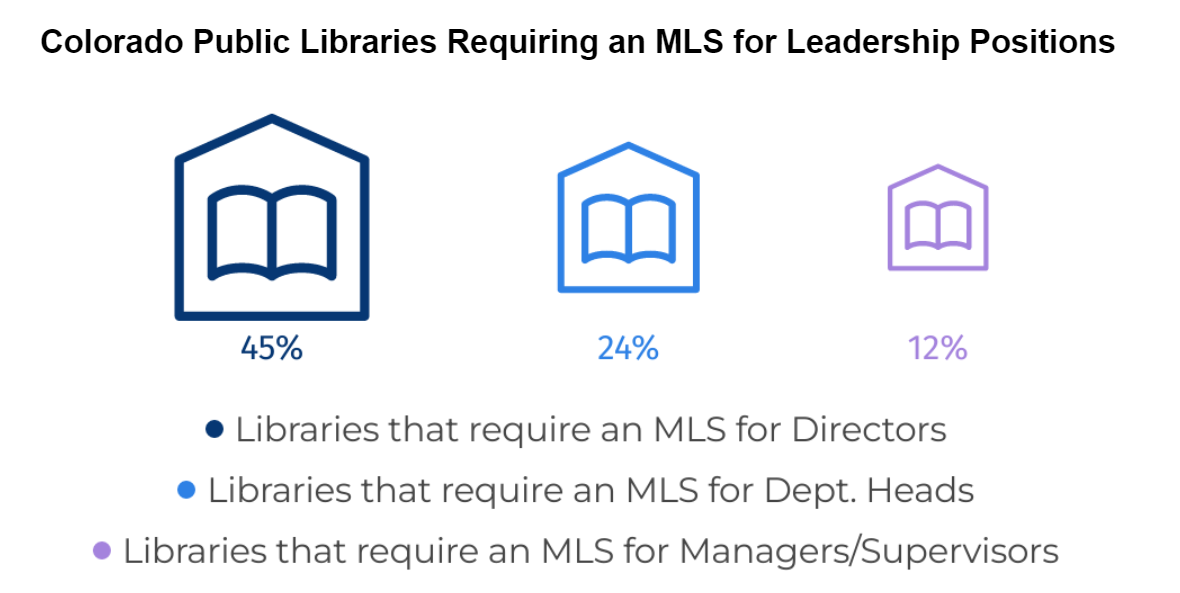
Comparing only these three leadership positions focuses the message of this visualization while still showing the spread of the data. Using percentages in Figure F, instead of actual data counts, also helps the audience immediately put the numbers into context without needing the reminder that this data was collected from 106 libraries. Pictogram charts can depict percentages or actual data counts. In this post, Figures A, B, and F show percentages while Figures C, D, and E use actual data counts.
In each of the six pictogram charts above, a different color is used for each category. In some cases, such as Figures C and D, the use of different colors is necessary to separate the data while in the size comparisons, it is just a visual aid to separate each icon. LRS will dedicate a whole Public Library Blueprints post on accessible use of color in data visuals, but for now, this resource can help you choose accessible color palettes for people with color blindness.
The Big Picture
To review, pictogram charts use icons, color, and/or size to visualize data in fun, memorable ways. Icons can be used by themselves or placed in bars or grids to grab an audience’s attention and communicate data effectively. The icon you choose should relate to your data, be simple enough to quickly identify, and not distract from your message. If you can’t find a simple icon related to your data, using a generic symbol such as a circle or star can work in some cases. All in all, the use of these small pictures can be a powerful tool to display data because they are engaging and can increase the accessibility of your data for a large audience with varying levels of data literacy. A well designed pictogram chart is definitely worth a thousand words.
LRS’s Colorado Public Library Data Users Group (DUG) mailing list provides instructions on data analysis and visualization, LRS news, and PLAR updates. To receive posts via email, please complete this form.