In 2002, the finances of the state’s public libraries were negatively affected by state and local budget cuts. A 2003 Fast Facts from LRS showed that library districts weathered these fiscal cuts better than non-district public libraries. The average local revenue of libraries which were not part of a library district decreased from the previous year. On the other hand, public libraries which were part of a library district actually saw an increase in their average per capita funding.
There have been four years of data collection between the dramatic fiscal changes of 2002 and today. How have library districts fared between 2002 and 2006? Have they continued to show strong financial stability? How do they compare to their non-district counterparts?
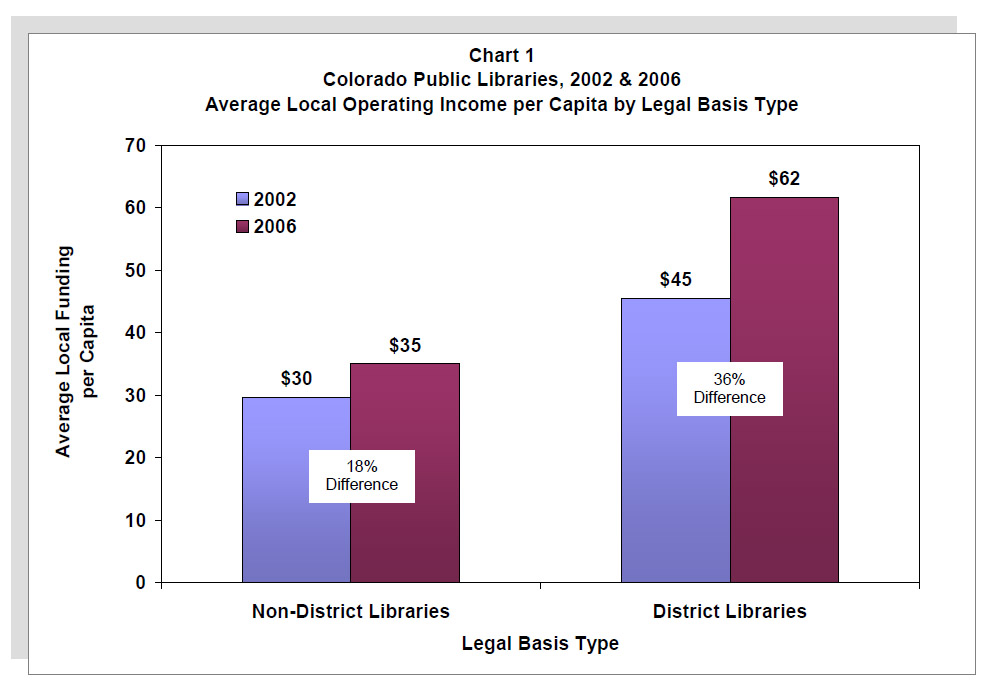
An examination of the change in percentage of average local operating income per capita between 2002 and 2006 reveals that both library districts and non-district libraries have increased their local income (see Chart 1). However, the percentage change for library districts is double that of non-district libraries. This is not too surprising given the stable, dedicated funding library districts tend to enjoy.
So, do these libraries with increased inputs—in the form of funding—also have increased outputs? In other words, if library districts have increased their funding more than non-district libraries, have they also increased the utilization of their resources and materials more than the other library types?
An examination of library visits per capita, circulation per capita, and program attendance per 1,000 served was performed for 2002 and 2006 to determine if patron usage had changed during this time (see Chart 2).
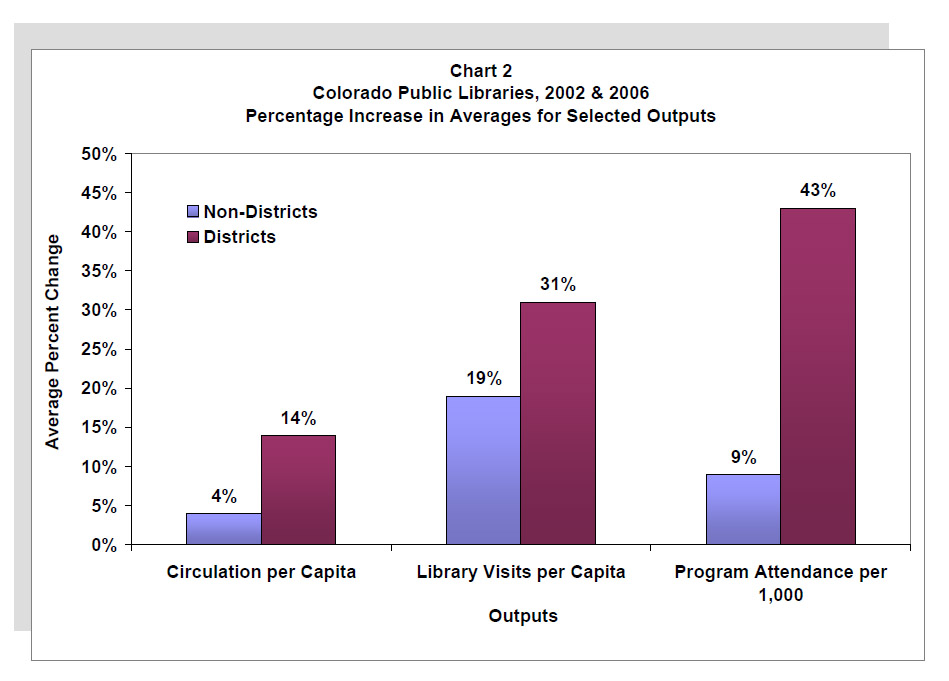
Between library districts and non-district libraries, the most dramatic difference in percent change comparisons was for program attendance. Library districts had an increase of 43 percent in average program attendance per 1,000 served between 2002 and 2006, while non-districts had only a 9 percent change.
Both library district and non-districts saw growth in the average number of library visits per capita in 2006 compared to 2002. Library districts had a 31 percent increase in visits compared to 19 percent for non-district libraries.
Although the percent change in average circulation was not as dramatic as library visits, both library types witnessed an increase in their circulation per capita. The percentage change between 2002 and 2006 for circulation in library districts was nearly 4 times higher than that of non-district libraries (14% vs 4%).
Library districts and non-district libraries have been able to rebound from the 2002 budget cuts with financial and community strength. Both library types have seen increases in their local funding and in their outcome measures. However, library districts have seen a greater increase in their funding which may be attributed to their autonomous nature. This stable funding has allowed library districts to increase their outputs as well. Library districts are not only more supported financially than their non-district peers, the populations they serve are entering their doors more often and utilizing their services more frequently.
Sources
- Lietzau, Z. (2003). Fast Facts: Colorado Library Districts Thrive While Other Library Types Face Big Cuts. Library Research Service, Colorado State Library. http://www.lrs.org/documents/fastfacts/193_nonfunding.pdf.
- Colorado Public Library Annual Report: 2001, 2002, & 2006. Library Research Service – Colorado
- State Library. http://www.LRS.org/pub_stats.php.